
Understanding The Audiogram
Your Audiologist is best placed to interpret your hearing test results and recommend appropriate hearing aids if indicated based on your audiogram results and clinical history.
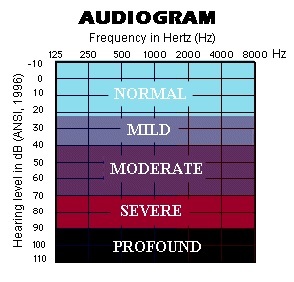
The Hearing Loss Chart is where your audiogram is plotted. It depicts the human audible range of hearing from 125 Hertz to 8000Hz upon which your unique hearing test results are recorded as threshold versus frequency. The depth of responses on the audiogram indicate the degree of hearing loss. The pitch of test tone increases from left to right much like the progression on a piano keyboard.
What Audiogram Symbols are used.
The audiogram symbols used to record the softest sounds you can hear are standardised. The air conduction threshold symbols are a red “0” for the right ear and a blue “x” for the left ear. The bone conduction symbols, which measure the cochlea response directly bypassing the middle ear are also colour coded as a blue bracket for the left ear >, and a red bracket for the right ear <. Variations on these symbols exist to represent when the ear is being masked.
Typical aged related hearing loss ranges from mild in the low pitches to moderate in the higher pitches, around 30 to 50 decibels of hearing loss progressively. Of course it can be much less or much more that this range. You will begin to notice difficulties typically when your response to a 2KHz tone is 30 dB or greater.
How do you read an Audiogram?
We look at the degree of hearing loss and the nature of the hearing loss per ear.
The Degree of Hearing Loss
The degree of hearing loss is categorised as being within one or more of the descriptors of Normal, Mild, Moderate, Moderately Severe, Severe and Profound.
The Nature of the Hearing Loss
The nature of a hearing loss falls into three categories as follows
- Sensorineural – being purely nerve related
- Conductive – being a resistance to the passage of sound
- Mixed – a combination of sensorineural and conductive hearing losses.
The Slope of the Hearing Loss
A “Flat” hearing loss is, as the name implies, showing mostly equivalent hearing loss at all frequencies. A sloping loss, which is typical in age related hearing loss, usually refers to a left low tone to right high tone slope, where the low tone thresholds are milder. A steeply sloping loss can be seen in noise exposure cases and “reverse slopes” or “cookie bite” audiograms suggest a genetic influence.
Additional Descriptive Terms to Describe an Audiogram
Other descriptive terms for an audiogram look at the symmetry of hearing loss A symmetric loss is when both ears more or less follow the same degree, slope and nature of hearing loss. An asymmetric loss is where these descriptors are dissimilar. A unilateral loss is when there is a total or significant hearing loss in one ear and the other is normal.